Data Analysis by: Robert Koehl, Verus’ Analytics Manager and Jose Thomas, Verus’ Senior Statistician
The news is filled every day with pandemic-related statistics: number of new cases, number of deaths, number of recoveries and so on. But what’s the real story behind the data?
Data concerning nursing home cases can be used to bring serious issues to light with a goal of identifying possible systemic challenges that must be addressed immediately and improving future responses to infectious disease outbreaks. Looking closely at the total number of COVID-19 cases reported in nursing homes and comparing it to the number of deaths in those facilities starts to reveal an interesting pattern. In our home state of New Jersey, much public attention has focused on counties reporting the highest number of cases in nursing homes, but the ratio of deaths to those total case counts tells us focusing on one or the other count in isolation may miss the true picture. As focus turns to the legal liabilities associated with COVID-19 cases, lawyers who are representing nursing home residents and their relatives will need to carefully craft a compelling case that is rooted in a true interpretation of the data.
Using data collected by the New Jersey Department of Health1, we have observed that the death-to-case ratio in certain counties stands out:
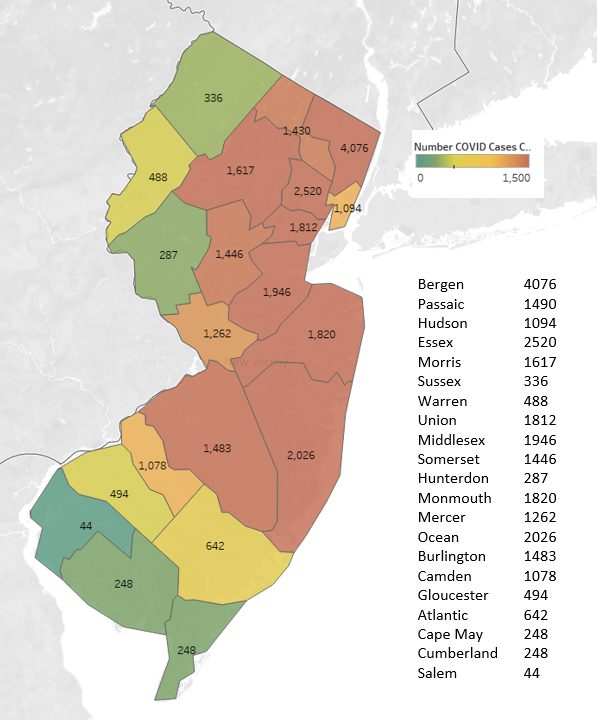
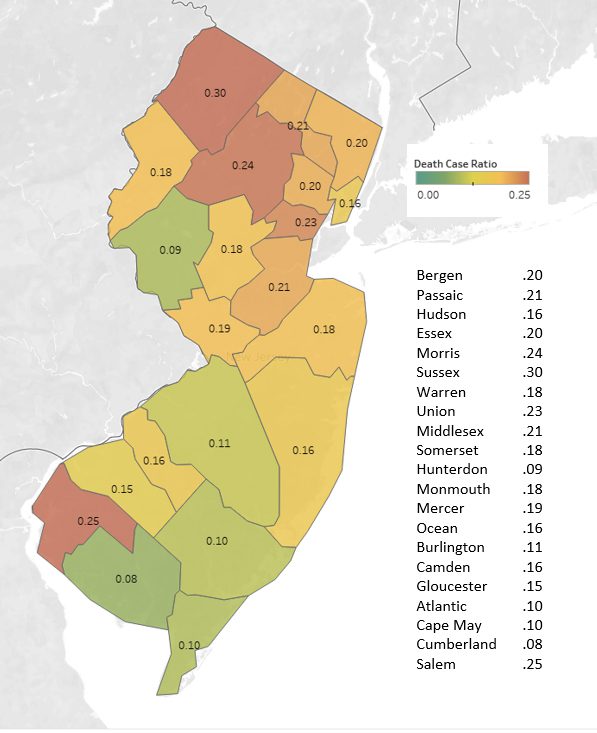
- Bergen County in the northeast corner of the state reported the highest number of nursing home COVID-19 cases. Yet, Sussex County, in the northwest corner, reported a significantly higher death-to-case ratio.
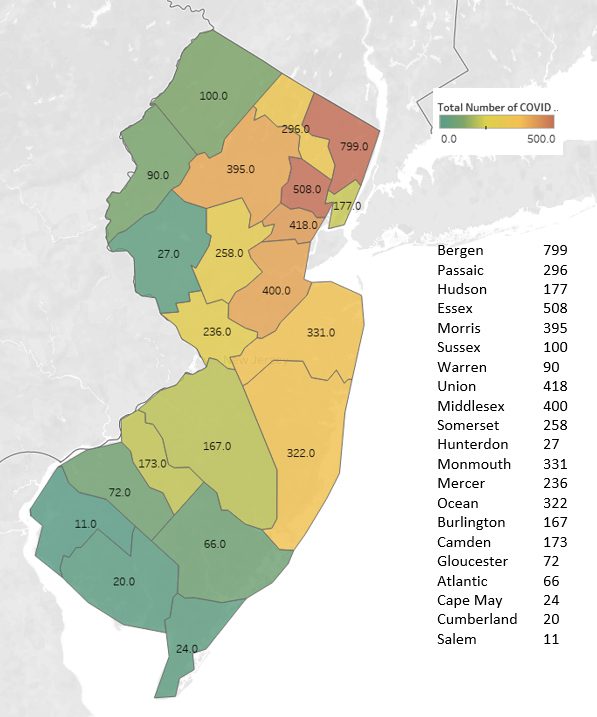
- Burlington County, which reported more than quadruple the number of COVID cases as Sussex, as well as a higher death count, had a much lower death-to-case ratio—nearly a third of the Sussex County ratio.
What do these data points tell epidemiologists, state officials, and families of the deceased? Were different practices in place in long-term care facilities in Sussex County which yielded the higher ratio than other counties that reported more total cases? Were interventions, treatments, staffing or overall readiness key factors? Simply looking at numbers in siloed sets does not tell the same story as looking more deeply at the data—and does not necessarily reveal the important questions surrounding how the coronavirus has affected nursing home residents.
Governments should be encouraged to continue collecting and publicly reporting this data and to motivate experts to mine it for insights that will improve public policy responses to future crises, as well as to assist our healthcare, financial, and legal systems in the monumental task of repairing the damage done by COVID-19.
Nursing Home Confirmed COVID Cases in NJ
Nursing Home Deaths from COVID in NJ
Nursing Home Death to Case Ratio in NJ
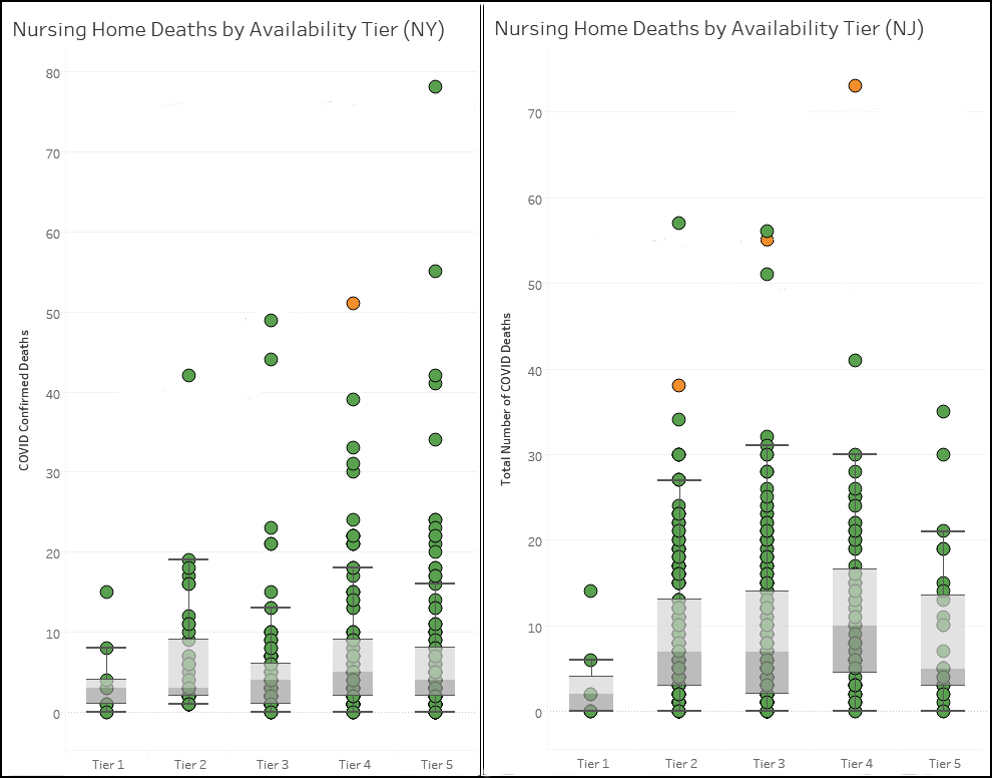
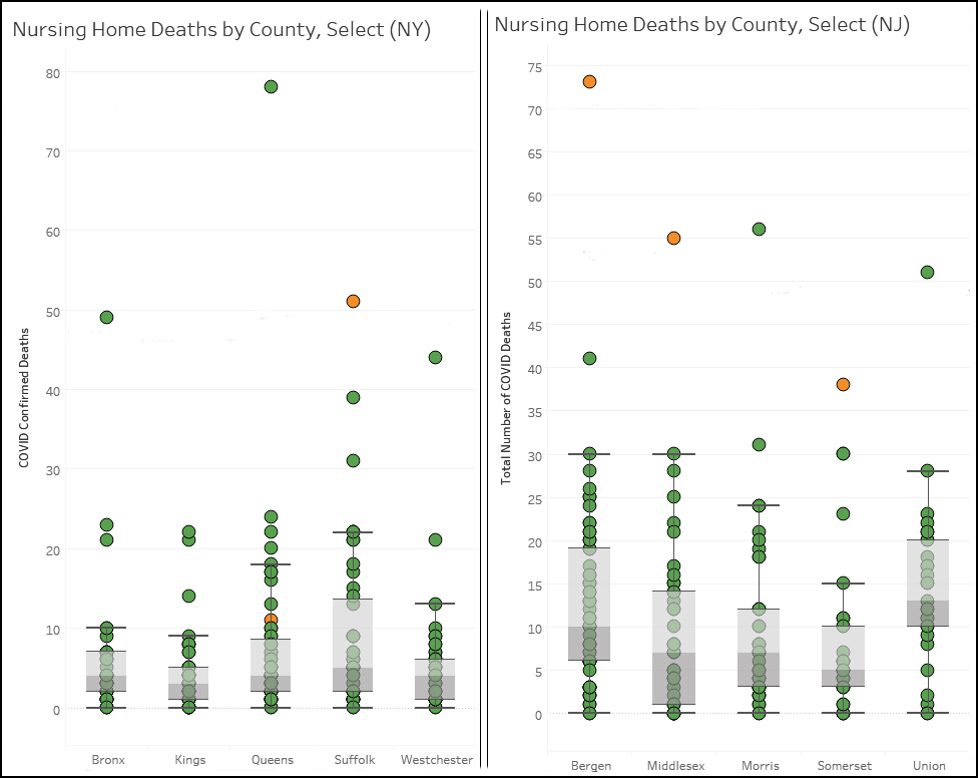
Mining data around nursing home availability tiers—which relate to the number of available beds per facility—also reveal the outliers whose incidence of COVID-19 cases and deaths are far above statistical means. The chart for New York2 and New Jersey identify nursing home hot spots by size; the county chart also reveals the counties in which high numbers of nursing home deaths occurred, and where.
While the stories behind the data are yet to be completely revealed, the numbers do raise questions and concerns about the care and protocols within nursing homes—and call into question if the states are collecting the right data in order to make informed decisions regarding pandemic-related guidelines for these medically fragile communities.
1 Includes all deaths reported by Long Term Care facilities to the Communicable Disease Service at the New Jersey Department of Health. All deaths may not be laboratory confirmed. The cases reported are self-reported by facilities at a point in time and may not reflect real-time data. Case numbers are constantly changing and subject to updates. (As of 5/11/2020)
2 The numbers displayed are a result of a comprehensive accounting of current and retrospective data, provided by facilities. This data captures COVID-19 confirmed and COVID-19 presumed deaths within nursing homes and adult care facilities. This data does not reflect COVID-19 confirmed or COVID-19 presumed positive deaths that occurred outside of the facility. Retrospective data reporting dates back to March 1, 2020. New York State Department of Health. (As of 5/11/2020)
Click on this link for information on Covid-19 Nursing Homes Liability Services. To contact us, fill out this form or email us at info@verusllc.com and we will reply immediately.